| Household income bracket in Australian dollars | Share of respondents |
|---|---|
| - | - |
| - | - |
| - | - |
The chart is not accessible to screen readers. Please switch to the table view to access the data.
Download
Source
Source
Release date
September 2024
More information
Region
Australia
Survey time period
March 2024
Number of respondents
1,250*
Age group
18 years and older
Special properties
nationally representative sample of Australian consumers
Method of interview
Online panel
Supplementary notes
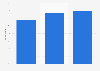
*Respondent distribution by household income:
- Less than 50,000 = 366
- 50,000 to 99,000 = 419
- 100,000 or more = 383
Survey question: And when purchasing these types of products, in general, which of the following criteria are important to you?
Citation formats