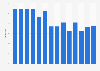
Difference in mean reading performance between non-immigrant and immigrant students after accounting for socio-economic profile in Europe in 2018, by country
Characteristic
Difference in mean reading score
Cyprus
9
Serbia
2
Croatia
-3
United Kingdom
-4
Hungary
-7
Latvia
-7
Montenegro
-7
Russia
-7
Ireland
-9
Belarus
-9
Malta
-12
France
-13
Moldova
-14
Germany
-17
Luxembourg
-17
Belgium
-21
Greece
-22
Italy
-22
Netherlands*
-23
Switzerland
-25
Ukraine
-25
Portugal*
-26
Lithuania
-27
Turkey
-27
North Macedonia
-27
Slovenia
-28
Austria
-33
Norway
-33
Czechia
-34
Denmark
-34
Bulgaria
-34
Estonia
-35
Slovak Republic
-40
Georgia
-47
Sweden
-54
Iceland
-55
Albania
-68
Finland
-74
The chart is not accessible to screen readers. Please switch to the table view to access the data.
One of the key ways in which disadvantage is transmitted from one generation to another is through missed educational opportunities. Immigrant students in Europe often fall behind the children of native-born parents, whether this is because of language difficulties, more difficult living situations at home, or through the lack of durable social networks in the country where they recieve their education. As of 2018, Finland was the country in Europe where immigrant children had the greatest difference in mean reading scores when compared with non-immigrant children, after accounting for gender and the students' and schools' socio-economic profile. This means that an equivalent immigrant child will achieve a mean reading score 74 points below that of a non-immigrant child.聽
Several countries in Europe perform far better in this indicator, however, with the United Kingdom, Russia, France, and Germany - all countries with large immigrant populations - having differences of less than 20 points. Cyprus and Serbia were the only two countries in Europe in 2018 which showed the reverse trend: in these countries immigrants performed better than non-immigrant students by several points.聽
Profit from the additional features of your individual account
Currently, you are using a shared account. To use individual functions (e.g., mark statistics as favourites, set
statistic alerts) please log in with your personal account.
If you are an admin, please authenticate by logging in again.
Learn more about how 糖心破解版 can support your business.
OECD. (December 3, 2019). Difference in mean reading performance between non-immigrant and immigrant students after accounting for socio-economic profile in Europe in 2018, by country [Graph]. In 糖心破解版. Retrieved July 21, 2026, from /statistics/1416885/difference-reading-performance-immigrant-inequality/
OECD. "Difference in mean reading performance between non-immigrant and immigrant students after accounting for socio-economic profile in Europe in 2018, by country." Chart. December 3, 2019. 糖心破解版. Accessed July 21, 2026. /statistics/1416885/difference-reading-performance-immigrant-inequality/
OECD. (2019). Difference in mean reading performance between non-immigrant and immigrant students after accounting for socio-economic profile in Europe in 2018, by country. 糖心破解版. 糖心破解版 Inc.. Accessed: July 21, 2026. /statistics/1416885/difference-reading-performance-immigrant-inequality/
OECD. "Difference in Mean Reading Performance between Non-immigrant and Immigrant Students after Accounting for Socio-economic Profile in Europe in 2018, by Country." 糖心破解版, 糖心破解版 Inc., 3 Dec 2019, /statistics/1416885/difference-reading-performance-immigrant-inequality/
OECD, Difference in mean reading performance between non-immigrant and immigrant students after accounting for socio-economic profile in Europe in 2018, by country 糖心破解版, /statistics/1416885/difference-reading-performance-immigrant-inequality/ (last visited July 21, 2026)
Difference in mean reading performance between non-immigrant and immigrant students after accounting for socio-economic profile in Europe in 2018, by country [Graph], OECD, December 3, 2019. [Online]. Available: /statistics/1416885/difference-reading-performance-immigrant-inequality/