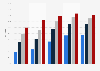
| Characteristic | Score difference between advantaged and disadvantaged students |
|---|---|
| Luxembourg | 122 |
| Hungary | 113 |
| Germany | 113 |
| Belgium | 109 |
| Romania | 109 |
| France | 107 |
| Slovakia | 106 |
| Bulgaria | 106 |
| Czechia | 105 |
| Switzerland | 104 |
| Moldova | 102 |
| Belarus | 102 |
| Portugal | 95 |
| Austria | 93 |
| Poland | 90 |
| Ukraine | 90 |
| Sweden | 89 |
| Lithuania | 89 |
| Netherlands | 88 |
| Malta | 87 |
| Greece | 84 |
| United Kingdom | 80 |
| Slovenia | 80 |
| North Macedonia | 80 |
| Finland | 79 |
| Denmark | 78 |
| Turkey | 76 |
| Ireland | 75 |
| Italy | 75 |
| Serbia | 73 |
| Norway | 73 |
| Iceland | 72 |
| Russia | 67 |
| Latvia | 65 |
| Croatia | 63 |
| Estonia | 61 |
| Albania | 61 |
| Bosnia and Herzegovina | 58 |
| Montenegro | 55 |
| Kosovo | 40 |
The chart is not accessible to screen readers. Please switch to the table view to access the data.
December 2019
Europe
2018
15 years old
*A socio-economically advantaged (disadvantaged) student is a student in the top (bottom) quarter of ESCS in his or her own country/economy
The Programme for International Student Assessment (PISA) is a triennial survey of 15-year-old students that assesses the extent to which they have acquired the key knowledge and skills essential for full participation in society. The assessment focuses on proficiency in reading, mathematics, science and an innovative domain (in 2018, the innovative domain was global competence), and on students鈥� well-being.
Some 600 000 students completed the assessment in 2018, representing about 32 million 15-year-olds in the schools of the 79 participating countries and economies.