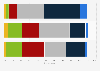
| Characteristic | Share of adults |
|---|---|
| 2025 | 28% |
| 2024 | 31% |
| 2023 | 32% |
| 2022 | 34% |
| 2021 | 36% |
| 2020 | 40% |
| 2019 | 41% |
| 2018 | 45% |
| 2017 | 41% |
| 2016 | 32% |
| 2015 | 40% |
| 2014 | 40% |
| 2013 | 44% |
| 2012 | 40% |
| 2011 | 44% |
| 2010 | 43% |
| 2009 | 45% |
| 2008 | 43% |
| 2007 | 47% |
| 2005 | 50% |
| 2004 | 44% |
| 2003 | 54% |
| 2002 | 54% |
| 2001 | 53% |
The chart is not accessible to screen readers. Please switch to the table view to access the data.
Zoomable Statistic: Select the range in the chart you want to zoom in on.
Loading statistic...
Download
Source
Source
Release date
October 2025
More information
Region
United States
Survey time period
2001 to 2025
Number of respondents
1,000 respondents
Age group
18 years and older
Method of interview
Telephone interview
Supplementary notes
Original question: "In general, how much trust and confidence do you have in the mass media 鈥� such as newspapers, TV and radio 鈥� when it comes to reporting the news fully, accurately and fairly 鈥� a great deal, a fair amount, not very much or none at all?"
Survey was not conducted in 2006.
Citation formats