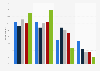
| Characteristic | Share of respondents |
|---|---|
| National politics or government | 50% |
| State or local politics or government | 42% |
| Information on traffic, transportation or weather | 41% |
| Crime and public safety | 37% |
| Business and the economy | 35% |
| Health, mental health, wellness or self-care | 31% |
| The environment | 28% |
| Sports | 27% |
| Schools and education | 27% |
| Social issues (e.g. abortion, gun policy or LGBTQ+ issues) | 26% |
| Celebrities, music, TV, movies or entertainment | 25% |
| I don't follow any topics regularly | 20% |
| Gaming or puzzles | 17% |
| Information related to one's job, industry or profession | 17% |
| Other | 2% |
The chart is not accessible to screen readers. Please switch to the table view to access the data.
Loading statistic...
Download
Source
Sources
Release date
April 2026
More information
Region
United States
Survey time period
February 2 to 16, 2026
Number of respondents
2,101 respondents
Age group
13 years and older
Special properties
methodology used was a mixture of interviews and omnibus surveys
Supplementary notes
Original question: "Here are some news and information topics. Which of these topics, if any, do you follow regularly? Please select all that apply."
Multiple answers were accepted.
Citation formats