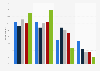
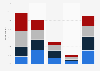
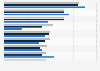
| Characteristic | At least once a day | At least once a week | Less than once a week | Never |
|---|---|---|---|---|
| TV/streaming | 46% | 24% | 11% | 18% |
| Digital news sites/apps | 41% | 24% | 11% | 23% |
| Social media | 37% | 24% | 8% | 29% |
| Search engines | 26% | 29% | 14% | 30% |
| Radio | 25% | 21% | 15% | 39% |
| Email/digital newsletters | 23% | 18% | 13% | 44% |
| Local print/digital newspapers/magazines | 18% | 17% | 17% | 47% |
| National print/digital newspapers/magazines | 15% | 19% | 17% | 49% |
| Podcasts | 13% | 15% | 15% | 56% |
| AI chatbots (e.g. ChatGPT, Claude, Gemini, Copilot) | 10% | 14% | 8% | 67% |
The chart is not accessible to screen readers. Please switch to the table view to access the data.
Loading statistic...
Download
Source
Sources
Release date
April 2026
More information
Region
United States
Survey time period
February 2 to 16, 2026
Number of respondents
2,101 respondents
Age group
13 years and older
Special properties
methodology used was a mixture of interviews and omnibus surveys
Supplementary notes
Original question: "How often, if at all, do you get news and information from each of the following?"
Citation formats