| Characteristic | Share of respondents |
|---|---|
| - | - |
| - | - |
| - | - |
| - | - |
| - | - |
| - | - |
The chart is not accessible to screen readers. Please switch to the table view to access the data.
Download
Source
Source
Release date
February 2022
More information
Region
United States
Survey time period
fall 2021
Special properties
among managers at companies with a minimum of one million U.S. dollars ad spend
Supplementary notes
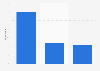
The graph shows the share of respondents rating the challenge 4 or 5 on a scale from 1 to 5.
Citation formats