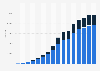

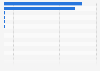


| Characteristic | Sales in billion U.S. dollars |
|---|---|
| - | - |
| - | - |
| - | - |
| - | - |
| - | - |
| - | - |
| - | - |
| - | - |
| - | - |
The chart is not accessible to screen readers. Please switch to the table view to access the data.
Download
Source
Sources
Release date
June 2025
More information
Region
Worldwide
Survey time period
2024
Supplementary notes
* Totals may not sum due to rounding. Estimates may not be directly comparable to previous reports due to periodic updates made by third-party sources. Revisions to third-party sources are typically related to incorporating new, higher-quality data sources, adjusting the weights assigned to different sources, or updating foreign-exchange rate assumptions.聽
** Billings and sales from digital goods and services are not the same as App Store billings. Sales from digital goods and services purchased elsewhere but used on apps on Apple devices are included, while billings from in-app purchases made via the App Store but used elsewhere are excluded. The estimate relies on third-party sources and Apple data.
*** Sales from physical goods and services rely on estimates from third-party sources. For general retail and grocery, total e-commerce and m-commerce sales are based on EMARKETER, 鈥淐ountry Retail eCommerce and mCommerce Sales鈥�. See Appendix for details.
**** iOS in-app ad revenue from ads placed by developers in their apps; does not include ad-network or other ad-tech revenue, advertising on mobile web, or search ads, including Apple Ads.
Citation formats