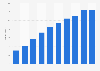


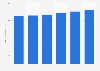

| Characteristic | Detractors | Passives | Promoters |
|---|---|---|---|
| - | - | - | - |
| - | - | - | - |
| - | - | - | - |
| - | - | - | - |
| - | - | - | - |
| - | - | - | - |
| - | - | - | - |
| - | - | - | - |
| - | - | - | - |
| - | - | - | - |
| - | - | - | - |
| - | - | - | - |
The chart is not accessible to screen readers. Please switch to the table view to access the data.
Download
Source
Source
Release date
October 2020
More information
Region
Denmark
Survey time period
2020
Number of respondents
1,241 respondents
Age group
18 years and older
Special properties
e-consumers
Method of interview
Online panel
Supplementary notes
This question was phrased by the source as follows: "Hvor sandsynligt er det, at du ville anbefale denne nettbutikk til familie, venner eller kollegaer?"
Percentage points exceeding 100 percent are probably due to rounding.
Missing percentage points to 100 percent are probably due to rounding.
Citation formats



