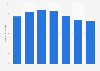
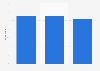
| Characteristic | Share of respondents |
|---|---|
| Price | 25% |
| Doubts about quality | 3% |
| Lack of availability | 3% |
| Did not find the equivalent sustainable product | 2% |
| Inferior aesthetics | 2% |
The chart is not accessible to screen readers. Please switch to the table view to access the data.
Loading statistic...
Download
Source
Source
Release date
July 2018
More information
Region
Brazil
Survey time period
2018
Number of respondents
1,090 respondents
Age group
16 years and older
Method of interview
Face-to-face interview
Supplementary notes
The numbers refer to the total share of respondents. However, the question was only posed to the 39% of respondents who claimed to know what a sustainable product was.
The question posed was "In situations where you would have bought a product or adopted a more sustainable practice, but didn't, what was the reason?". The question admitted multiple, spontaneous answers.
The source does not provide the exact survey date.
Citation formats