

| Characteristic | Share of non-buyers |
|---|---|
| - | - |
| - | - |
| - | - |
| - | - |
The chart is not accessible to screen readers. Please switch to the table view to access the data.
Download
Source
Sources
Release date
February 2018
More information
Region
India
Survey time period
As of February 2018
Number of respondents
501 and 1,845 and 18,000 respondents
Special properties
non-buyers
Supplementary notes
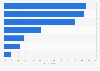
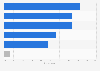
The original survey question was phrased as follows: "Could you please tell me the top 3 reasons why you didn't buy this [category] online? Only top rank considered for analysis.".
Data sourced from three different surveys.
Citation formats



