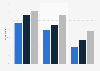
| Characteristic | TV | Radio | Books (printed + e-books) | Cinema | Media | Newspapers (printed + e-papers) | Music streaming | Magazines (printed + e-magazines) | DVD, blu-ray | Podcasts | Audio books | Online videos |
|---|---|---|---|---|---|---|---|---|---|---|---|---|
| 2014 | 95% | 94% | 83% | 80% | - | 94% | - | 83% | 75% | - | - | 53% |
| 2015 | 97% | 90% | 76% | 82% | - | 87% | - | 76% | 74% | - | - | 51% |
| 2016 | 95% | 92% | 89% | 86% | - | 90% | - | 78% | 75% | - | - | 61% |
| 2017 | 95% | 95% | 91% | 85% | - | 90% | - | 83% | 74% | - | - | 73% |
| 2018 | 93% | 93% | 90% | 83% | - | 85% | 34% | 75% | 75% | 24% | 37% | 77% |
| 2019 | 91% | 91% | 86% | 83% | - | 77% | 51% | 63% | 70% | 24% | 32% | 78% |
| 2020 | 91% | 91% | 86% | 82% | 59% | 77% | 57% | 64% | 67% | 32% | 36% | - |
| 2021 | 89% | 90% | 84% | 76% | 62% | 75% | 63% | 61% | 60% | 38% | 38% | - |
| 2022 | 87% | 90% | 86% | 78% | 63% | 72% | 62% | 57% | 58% | 37% | 35% | - |
| 2023 | 87% | 86% | 82% | 75% | 68% | 67% | 63% | 57% | 52% | 43% | 39% | - |
| 2024 | - | 88% | 84% | 75% | 71% | 68% | 64% | 61% | 48% | 49% | 38% | - |
The chart is not accessible to screen readers. Please switch to the table view to access the data.
Loading statistic...
Download
Source
Source
In cooperation with
Seven.One Media GmbH
Release date
October 2024
More information
Region
Germany
Survey time period
2014 to 2024, spring each year
Age group
14-69 years
Method of interview
Computer-assisted telephone interviews (CATI)
Supplementary notes
Some values were not reported on an annual basis in 2020, 2021, 2022 and 2024.
鹿From 2020, the value from the 2nd wave of the year / 2nd quarter as the average of the last four quarters (rolling). See the study on pages 36 and 87 for more details.聽
Number of respondents: 2014 (n=1,230) 2015 (n=2,486) 2016 (n=2,453) 2017 (n=2,464) 2018 (n=2,469) 2019 (n=2,468) 2020 (n=2,461) 2021 (n=2,458) 2022 (n=2,453) 2023 (n= 2,450)
Citation formats