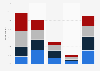
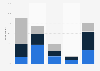
| Characteristic | Share of respondents who thought they'd encounter fake news stories |
|---|---|
| 58% | |
| Internet News Sites | 51% |
| 49% | |
| Saturday Night Live | 39% |
| Fox News | 24% |
| Radio Talk Shows | 24% |
| The Daily Show | 24% |
| CNN | 24% |
| MSNBC | 17% |
| The New York Times | 17% |
| Good Morning America (ABC) | 15% |
| CBS This Morning (CBS) | 14% |
| The Today Show (NBC) | 14% |
| USA Today | 13% |
| ABC World News Tonight | 13% |
| Local Radio News Stations | 12% |
| Meet the Press (NBC) | 12% |
| CBS Evening News | 12% |
| NBC Nightly News | 12% |
| Local Newspapers | 11% |
| 60 Minutes (CBS) | 11% |
| NPR (National Public Radio) | 11% |
| Face the Nation (CBS) | 11% |
| PBS News Hour | 9% |
| Local TV News | 8% |
The chart is not accessible to screen readers. Please switch to the table view to access the data.
Loading statistic...
Download
Source
Sources
Release date
February 2017
More information
Region
United States
Survey time period
January 27, 2017
Number of respondents
1,007 respondents
Age group
18 years and older
Method of interview
Online survey
Citation formats