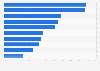
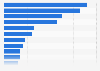
| Characteristic | Yes | No | I don't use this platform |
|---|---|---|---|
| World | 44% | 39% | 17% |
| Turkey | 72% | 18% | 11% |
| Egypt | 60% | 26% | 14% |
| Russia | 57% | 21% | 23% |
| Kenya | 57% | 37% | 5% |
| Brazil | 55% | 34% | 11% |
| Tunisia | 53% | 25% | 21% |
| Italy | 52% | 35% | 13% |
| Mexico | 49% | 38% | 13% |
| India | 48% | 41% | 11% |
| United States | 47% | 34% | 20% |
| Indonesia | 47% | 41% | 12% |
| Poland | 47% | 38% | 15% |
| South Africa | 47% | 39% | 15% |
| Nigeria | 46% | 39% | 15% |
| Sweden | 45% | 41% | 14% |
| Hong Kong | 39% | 45% | 16% |
| China | 39% | 44% | 17% |
| Australia | 37% | 41% | 22% |
| Canada | 35% | 43% | 22% |
| Great Britain | 34% | 43% | 23% |
| Republic of Korea | 33% | 47% | 21% |
| Germany | 32% | 50% | 18% |
| France | 31% | 45% | 24% |
| Pakistan | 27% | 60% | 12% |
| Japan | 19% | 46% | 35% |
The chart is not accessible to screen readers. Please switch to the table view to access the data.
Loading statistic...
Download
Source
Sources
Release date
June 2019
More information
Region
Worldwide
Survey time period
December 21, 2018 to January 4, 2019
Number of respondents
25,229 respondents
Age group
16-64 years*
Method of interview
Online panel
Supplementary notes
*Respondents in the United States and Canada were aged 18 to 64 years.
Citation formats