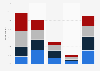
| Characteristic | Share of respondents |
|---|---|
| - | - |
| - | - |
| - | - |
| - | - |
| - | - |
| - | - |
| - | - |
| - | - |
| - | - |
The chart is not accessible to screen readers. Please switch to the table view to access the data.
Download
Source
Source
Release date
February 2020
More information
Region
United States
Survey time period
October and November 2019
Number of respondents
12,043 respondents
Age group
18 years and older
Special properties
who have heard of and trusted news outlet
Method of interview
Online panel
Supplementary notes
% who trust each source for political and election news (sources trusted by 33% or more shown)
Respondents were shown grids of 30 news outlets and asked to select the ones that they had heard of. If they had heard of an outlet, they were asked if they trusted it for political and election news. If they didn鈥檛 say that they trust an outlet, they were then asked if they distrusted it.
Multiple answers were possible.
Citation formats