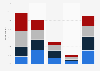
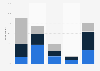
| Characteristic | YouTube | Facebook Messenger | TikTok | X (formerly Twitter) | |||
|---|---|---|---|---|---|---|---|
| 2019 | 25% | 40% | 8% | 12% | - | 11% | 4% |
| 2020 | 27% | 41% | 10% | 13% | - | 13% | 6% |
| 2021 | 27% | 41% | 13% | 18% | - | 11% | 8% |
| 2022 | 32% | 40% | 12% | 18% | - | 11% | 9% |
| 2023 | 25% | 29% | 10% | 11% | 6% | 11% | - |
| 2024 | 29% | 25% | 13% | 11% | 8% | 11% | - |
| 2025 | 28% | 25% | 13% | 10% | - | 11% | 10% |
| 2026 | 35% | 33% | 17% | 14% | 11% | 10% | - |
The chart is not accessible to screen readers. Please switch to the table view to access the data.
Zoomable Statistic: Select the range in the chart you want to zoom in on.
Loading statistic...
Download
Source
Sources
Release date
June 2026
More information
Region
Canada
Survey time period
2019 to 2026
Number of respondents
2,059 respondents
Age group
18 years and older
Special properties
TikTok not included in the most used services in the 2023 or 2024 survey, TikTok included for the first time in 2023
Method of interview
Online survey
Supplementary notes
Respondents count by year was as follows:
2019: 2,055
2020: 2,002
2021: 2,036
2022: 2,012
2023: 2,150
2024: 2,014
2025: 2,031
2026: 2,059
Citation formats