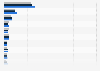
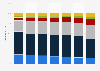
| Size of practice | Fewer than 5 physicians | 5 to 10 physicians | 11-24 physicians | 25-49 physicians | 50 or more physicians | Direct hospital employee/contractor |
|---|---|---|---|---|---|---|
| - | - | - | - | - | - | - |
| - | - | - | - | - | - | - |
| - | - | - | - | - | - | - |
| - | - | - | - | - | - | - |
| - | - | - | - | - | - | - |
| - | - | - | - | - | - | - |
| - | - | - | - | - | - | - |
The chart is not accessible to screen readers. Please switch to the table view to access the data.
Download
Source
Source
Release date
June 2025
More information
Region
United States
Survey time period
September-November 2024
Number of respondents
3,500 respondents
Supplementary notes
Post-residency physicians who provide at least 20 hours of patient care per week, not employed by the federal government, and practice in one of the 50 states or the District of Columbia
Citation formats