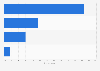
| Characteristic | Share of respondents |
|---|---|
| I'm prepared to pay for technology, but the latest styles are less important | 36% |
| I'm prepared to pay for style and technology | 28% |
| I'm not prepared to pay extra for either technology or style | 25% |
| I'm prepared to pay for style, but the latest technology is less important | 11% |
The chart is not accessible to screen readers. Please switch to the table view to access the data.
Loading statistic...
Download
Source
Source
Release date
November 2012
More information
Region
United Kingdom
Survey time period
August 2012
Number of respondents
1,298 respondents
Age group
16 years and older
Special properties
nationally representative
Supplementary notes
* The source did not provide information regarding the exact survey question.
This statistic is using original data from the Government Digital Service and includes copyright material from 漏 Crown, licensed under the
Citation formats