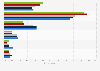
| Characteristic | 16-24 | 25-34 | 35-44 | 45-54 (since 2014)/ 45+ (2012 to 2013) | 55+ (since 2014) |
|---|---|---|---|---|---|
| 2015 | 7.4 | 4.8 | 4.4 | 4.4 | 6.6 |
| 2014 | 7.4 | 5.9 | 4.4 | 4.5 | 5 |
| 2013 | 7.9 | 4.9 | 4 | 4 | - |
| 2012 | 7 | 5.8 | 3.4 | 5.9 | - |
The chart is not accessible to screen readers. Please switch to the table view to access the data.
Loading statistic...
Download
Source
Source
Release date
April 2016
More information
Region
United Kingdom
Survey time period
2012 to 2015**
Number of respondents
654***
Age group
16 years and older
Special properties
adults who play games at home or elsewhere
Method of interview
Computer-assisted personal interviews (CAPI)
Supplementary notes
* The original survey question was "Please think about the hours that you spend game playing in a typical week 鈥搒o both weekdays and at the weekend... How many hours in a typical week would you say you play games?" (Unprompted responses)
** Date of most recent survey was October to November 2014.
*** n (2012) = 551; n (2013) = 604; n (2014) = 743; n (2015) = 654.
Data for years previous to 2015 published earlier by the source.
Citation formats