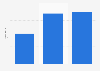


| Characteristic | Unit sales in millions |
|---|---|
| Q4 '18 | 46.89 |
| Q3 '18 | 41.3 |
| Q2 '18 | 52.22 |
| Q1 '18 | 77.32 |
| Q4 '17 | 46.68 |
| Q3 '17 | 41.03 |
| Q2 '17 | 50.76 |
| Q1 '17 | 78.29 |
| Q4 '16 | 45.51 |
| Q3 '16 | 40.4 |
| Q2 '16 | 51.19 |
| Q1 '16 | 74.78 |
| Q4 '15 | 48.05 |
| Q3 '15 | 47.53 |
| Q2 '15 | 61.17 |
| Q1 '15 | 74.47 |
| Q4 '14 | 39.27 |
| Q3 '14 | 35.2 |
| Q2 '14 | 43.72 |
| Q1 '14 | 51.03 |
| Q4 '13 | 33.8 |
| Q3 '13 | 31.24 |
| Q2 '13 | 37.43 |
| Q1 '13 | 47.79 |
| Q4 '12 | 26.91 |
| Q3 '12 | 26.03 |
| Q2 '12 | 35.06 |
| Q1 '12 | 37.04 |
| Q4 '11 | 17.07 |
| Q3 '11 | 20.34 |
| Q2 '11 | 18.65 |
| Q1 '11 | 16.24 |
| Q4 '10 | 14.1 |
| Q3 '10 | 8.4 |
| Q2 '10 | 8.75 |
| Q1 '10 | 8.74 |
| Q4 '09 | 7.37 |
| Q3 '09 | 5.21 |
| Q2 '09 | 3.79 |
| Q1 '09 | 4.36 |
| Q4 '08 | 6.89 |
| Q3 '08 | 0.72 |
| Q2 '08 | 1.7 |
| Q1 '08 | 2.32 |
| Q4 '07 | 1.12 |
| Q3 '07 | 0.27 |
The chart is not accessible to screen readers. Please switch to the table view to access the data.
Loading statistic...
Download
Source
Source
Release date
November 2018
More information
Region
Worldwide
Survey time period
2007 to 2018
Supplementary notes
The quarterly periods for Apple's fiscal year include the following: early October to late December of the previous year (first quarter), early January to late March of the stated year (second quarter), early April to late June of the stated year (third quarter) and early July to late September of the stated year (fourth quarter). The Apple iPhone was first sold in June 2007.
*Apple stopped reporting unit sales figures from 1st quarter 2019. For more current iPhone unit sales data, see here.
Citation formats