| Calendar week | Index compared to 2019 |
|---|---|
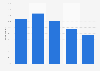
| 51 | 100 |
| 50 | 87 |
| 49 | 98 |
| 48 | 99 |
| 47 | 104 |
| 46 | 121 |
| 45 | 108 |
| 44 | 102 |
| 43 | 101 |
| 42 | 103 |
| 41 | 100 |
| 40 | 104 |
| 39 | 111 |
| 38 | 114 |
| 37 | 112 |
| 36 | 102 |
| 35 | 102 |
| 34 | 103 |
| 33 | 106 |
| 32 | 105 |
| 31 | 105 |
| 30 | 108 |
| 29 | 110 |
| 28 | 109 |
| 27 | 108 |
| 26 | 112 |
| 25 | 114 |
| 24 | 114 |
| 23 | 109 |
| 22 | 114 |
| 21 | 116 |
| 20 | 120 |
| 19 | 124 |
| 18 | 121 |
| 17 | 111 |
| 16 | 101 |
| 15 | 101 |
| 14 | 108 |
| 13 | 132 |
| 12 | 155 |
| 11 | 161 |
| 10 | 139 |
| 9 | 115 |
| 8 | 109 |
| 7 | 108 |
| 6 | 108 |
| 5 | 101 |
| 4 | 97 |
The chart is not accessible to screen readers. Please switch to the table view to access the data.
Zoomable Statistic: Select the range in the chart you want to zoom in on.
Loading statistic...
Download
Source
Source
Release date
March 2021
More information
Region
United States
Survey time period
Week 4 to 51, 2020
Number of respondents
~100,000 static panelists
Method of interview
Panel survey
Supplementary notes
Release date is the date of access.
The source adds the following information: "The Numerator Stockpiling Index provides the most detailed view into consumer behavior, showing how in-store stockpiling behaviors have changed throughout the duration of COVID-19."
Pantry filling is defined by the source as: "Weekly spend that is 1.5x higher than in an average week."
The "base" index of 100 points is defined by the source as: "Average weekly spend normalized to each household."
Citation formats