
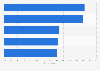


| Characteristic | Share of businesses |
|---|---|
| - | - |
| - | - |
| - | - |
| - | - |
The chart is not accessible to screen readers. Please switch to the table view to access the data.
Download
Source
Source
Release date
February 2024
More information
Region
Australia
Survey time period
October 6 to November 8, 2023
Number of respondents
108*
Supplementary notes
*Survey across 2,700 commerce leaders across North America, Asia-Pacific, South America, and Europe. Australian commerce leaders accounted for four percent of the total respondents.
Buying activity was collected from websites operating on Salesforce Commerce Cloud. To qualify for inclusion, a digital commerce site must have conducted transactions throughout the analysis period (Q4 2022 through Q3 2023) and met a monthly minimum visit and order threshold.
Citation formats




