| Characteristic | Less | More |
|---|---|---|
| - | - | - |
| - | - | - |
| - | - | - |
The chart is not accessible to screen readers. Please switch to the table view to access the data.
Download
Source
Source
Release date
June 2023
More information
Region
United States
Survey time period
April 2023
Number of respondents
1,500鹿
Age group
21 to 65 years old
Supplementary notes
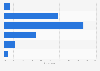
鹿 Total survey sample. Number of respondents for full service = 1,411; for fast casual = 1,370; for fast food chains = 1,398.
Respondents were asked how often they ate out at the specific type of restaurant compared to six months prior to being surveyed.
Citation formats