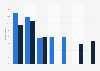
| Characteristic | Decreased | Unchanged | Increased | Increased significantly | Not sure |
|---|---|---|---|---|---|
| Food | 2% | 3% | 22% | 72% | 1% |
| Kitchen appliances and dishes | 2% | 6% | 34% | 55% | 3% |
| Pet food and accessories | 1% | 29% | 41% | 23% | 6% |
| DIY, home improvement, gardening | 1% | 27% | 32% | 22% | 17% |
| Household items | 1% | 24% | 43% | 22% | 10% |
| Body care products | 2% | 30% | 44% | 16% | 9% |
| Vitamins, food supplements and over the counter medicine | 1% | 30% | 38% | 15% | 17% |
| Consumer electronics | 2% | 38% | 25% | 14% | 21% |
| Decorations and furniture | 1% | 32% | 31% | 13% | 22% |
| Sports and outdoor equipment | 1% | 34% | 30% | 12% | 23% |
| Clothing | 2% | 36% | 32% | 12% | 17% |
| Skin care and make-up | 1% | 34% | 39% | 12% | 13% |
| Jewelry | 3% | 37% | 22% | 11% | 27% |
| Accessories | 1% | 42% | 24% | 10% | 24% |
| Shoes | 2% | 40% | 26% | 9% | 22% |
The chart is not accessible to screen readers. Please switch to the table view to access the data.
Loading statistic...
Download
Source
Source
In cooperation with
McKinsey & Company
Release date
May 2022
More information
Region
Germany
Survey time period
April 12-18, 2022
Number of respondents
1,028 respondents
Age group
18 years and older
Supplementary notes
Percentage points deviating from 100 percent are probably due to rounding.
Citation formats