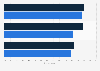
| Characteristic | under 40,000 CAD | Between 40,000 and 100,000 CAD | Over 100,000 CAD |
|---|---|---|---|
| Q4 2025 | 4.95% | 4.04% | 3.83% |
| Q3 2025 | 4.72% | 3.19% | 3.13% |
| Q2 2025 | 4.38% | 3.91% | 3.16% |
| Q1 2025 | 4.65% | 3.95% | 3.28% |
| Q4 2024 | 4.51% | 3.98% | 3.42% |
| Q3 2024 | 5.99% | 4.38% | 4.07% |
| Q2 2024 | 6.98% | 5.17% | 5% |
| Q1 2024 | 6.01% | 5.3% | 5% |
| Q4 2023 | 6.85% | 5.92% | 5.52% |
| Q3 2023 | 7.86% | 6.19% | 6.06% |
| Q2 2023 | 7.37% | 7.05% | 6.89% |
| Q1 2023 | 7.4% | 7.11% | 7.1% |
| Q4 2022 | 8.27% | 7.92% | 7.88% |
| Q3 2022 | 8% | 7.94% | 7.96% |
| Q2 2022 | 6.52% | 6.03% | 6.13% |
| Q1 2022 | 5.08% | 4.98% | 5.11% |
| Q4 2021 | 4.36% | 4.45% | 4.07% |
| Q3 2021 | 3.94% | 3.01% | 2.95% |
| Q2 2021 | 3.15% | 2.55% | 2.04% |
| Q1 2021 | 2.31% | 2.02% | 1.95% |
| Q4 2020 | 2.77% | 2.08% | 1.97% |
| Q3 2020 | 2.17% | 2.07% | 1.97% |
| Q2 2020 | 2.07% | 2.06% | 2% |
| Q1 2020 | 2.49% | 2.1% | 2.08% |
| Q4 2019 | 2.44% | 2.07% | 2.05% |
| Q3 2019 | 2.92% | 2.01% | 2.05% |
| Q2 2019 | 2.91% | 2.08% | 2.07% |
| Q1 2019 | 2.98% | 2.24% | 2.08% |
| Q4 2018 | 2.89% | 2.1% | 2.23% |
| Q3 2018 | 2.93% | 2.44% | 2.21% |
| Q2 2018 | 2.98% | 2.64% | 2.34% |
| Q1 2018 | 3.26% | 2.38% | 2.23% |
| Q4 2017 | 2.6% | 2.1% | 1.98% |
| Q3 2017 | 2.94% | 2.02% | 1.96% |
| Q2 2017 | 3.16% | 2.1% | 2% |
| Q1 2017 | 3.03% | 2.07% | 2.01% |
| Q4 2016 | 3.02% | 2.05% | 1.95% |
| Q3 2016 | 3.21% | 2.04% | 1.98% |
| Q2 2016 | 3.61% | 2.04% | 1.97% |
| Q1 2016 | 3.41% | 2.07% | 1.98% |
| Q4 2015 | 3.05% | 2.02% | 1.97% |
| Q3 2015 | 3.2% | 2.07% | 1.96% |
| Q2 2015 | 3.01% | 2.05% | 1.99% |
| Q1 2015 | 2.96% | 2.04% | 1.96% |
| Q4 2014 | 3.26% | 2.48% | 2.07% |
The chart is not accessible to screen readers. Please switch to the table view to access the data.
Zoomable Statistic: Select the range in the chart you want to zoom in on.
Loading statistic...
Download
Source
Source
Release date
March 2026
More information
Region
Canada
Survey time period
Q4 2014 to Q4 2025
Number of respondents
approximately 2,000*
Special properties
heads of households
Method of interview
Online panel
Supplementary notes
The source explains that the figures are median values.
Respondents were asked about current inflation rates, i.e., what they believed the rate of inflation (deflation) was over the past 12 months.
* The source adds that before the second quarter of 2018, the survey consisted of 1,000 respondents.
Adapted from Statistics Canada, bankofcanada.ca, Q4 2014 to Q4 2025. This does not constitute an endorsement by Statistics Canada of this product.
The date of release is the date of last access.
Citation formats