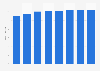
| Characteristic | Time in hours.minutes |
|---|---|
| - | - |
| - | - |
| - | - |
| - | - |
| - | - |
The chart is not accessible to screen readers. Please switch to the table view to access the data.
Download
Source
Source
Release date
November 2022
More information
Region
United States
Survey time period
as of November 2022
Number of respondents
4,001 respondents
Age group
18 years and older
Supplementary notes
The source does not provide exact date of survey for this data. The date provided is the release date.
The source adds the following information: "Behaviors averaged over 7 days. Figures do not sum due to rounding.
"'Other' includes media activities outside of the listed categories, such as browsing websites, reading, and attending live events."
Citation formats