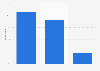
| Characteristic | Share of posts per day |
|---|---|
| - | - |
| - | - |
| - | - |
| - | - |
| - | - |
| - | - |
| - | - |
| - | - |
| - | - |
| - | - |
| - | - |
| - | - |
| - | - |
| - | - |
| - | - |
| - | - |
| - | - |
| - | - |
| - | - |
| - | - |
| - | - |
| - | - |
| - | - |
| - | - |
| - | - |
| - | - |
| - | - |
| - | - |
| - | - |
| - | - |
| - | - |
| - | - |
| - | - |
| - | - |
| - | - |
The chart is not accessible to screen readers. Please switch to the table view to access the data.
Download
Source
Source
Release date
January 2021
More information
Region
Worldwide
Survey time period
January 2019 to October 2020
Special properties
2,5479 Twitter profiles, 11,983,611 Twitter posts
Supplementary notes
According to the source: "To identify social media industry benchmarks on Facebook, Instagram, and Twitter, we analyzed more than 22 million posts from a total of 56,296 business pages from United States with the help of the Socialinsider tool."
Always according to the source:"The average engagement rate per post is defined as the average engagement of the posts divided by the number of fans or followers the page has all multiplied by 100."
Citation formats