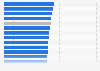
| Characteristic | Number of messages |
|---|---|
| - | - |
| - | - |
| - | - |
| - | - |
| - | - |
| - | - |
| - | - |
| - | - |
| - | - |
| - | - |
The chart is not accessible to screen readers. Please switch to the table view to access the data.
Download
Source
Source
Release date
January 2020
More information
Region
Italy
Survey time period
Q4 2019
Supplementary notes
*Sources included:
social media (i.e. Facebook, Twitter, Google+, Instagram, Youtube), blogs, online forums, websites of news and reviews, apps (i.e. Google Play, App Store) and channels owned by the main firms of the automotive industry.
The ranking was calculated summing the posts published in the period of consideration and the number of relative comments. The messages were written in the Italian language and mentioned the major brands of the automotive sector.
Citation formats