| Characteristic | Share of respondents |
|---|---|
| - | - |
| - | - |
| - | - |
| - | - |
| - | - |
The chart is not accessible to screen readers. Please switch to the table view to access the data.
Download
Source
Source
Release date
June 2021
More information
Region
United States
Survey time period
October 2020 to March 2021
Number of respondents
8,681**
Age group
18 years and older
Special properties
on a weekly or daily basis
Supplementary notes
* E.g. Amazon Echo, Google Home, Samsung SmartThings.
** Total sample size for 22 territories surveyed. The number of respondents for individual countries/regions was not provided by the source.
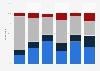
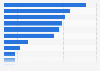
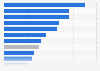
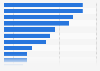
This question was phrased as follows: "In the past 12 months, how often have you bought products (e.g., clothes, books, electronics) using the following shopping channels?". Data reflects respondents who answered 'weekly' or 'daily'.
Citation formats