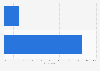
| Characteristic | Share of respondents |
|---|---|
| Dry food items (rice, noodles, pasta, flour...) | 78% |
| Personal hygiene products (soap, shampoo, hand soap...) | 57% |
| Medical supplies (disinfectant, sanitisers, surgical masks, household medication...) | 56% |
| Fresh meat and vegetables | 38% |
| Frozen food items (frozen vegetables, frozen pizza, frozen meat...) | 37% |
| Hygiene paper products (toilet paper, paper towels, tissues, wet wipes...) | 36% |
| Canned and preserved goods (canned vegetables, canned soup, pickled vegetables, pasta sauce...) | 30% |
| Others | 8% |
The chart is not accessible to screen readers. Please switch to the table view to access the data.
Loading statistic...
Download
Source
Source
In cooperation with
Rakuten Insight
Release date
May 2020
More information
Region
India
Survey time period
April 9 to 30, 2020
Number of respondents
7,847 respondents
Age group
16 years and older
Special properties
among 2,466 female and 5,381 male respondents that engaged in panic buying
Method of interview
Online survey
Supplementary notes
Original question: What items did you stock up on?
Citation formats