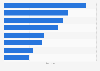


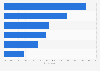

| Characteristic | Share of respondents |
|---|---|
| Dry food items (rice, flour, pasta, noodles, powdered milk, etc) | 62.58% |
| Canned and tinned foods (canned vegetables, canned fish, corned beef, etc) | 48.01% |
| Sweets and snack items | 42.68% |
| Fresh produce (meat, poultry, fish, fresh vegetables and fruit, eggs, etc) | 34.32% |
| Vitamins and nutritional supplements | 32.72% |
| Milk and dairy | 32.48% |
| Frozen food | 31.53% |
| Instant noodles | 31.05% |
| Condiments and seasonings (cooking oil, salt, sugar, etc) | 25.8% |
| Non-alcoholic beverages | 25.64% |
| Alcoholic beverages | 14.73% |
| Others | 5.41% |
The chart is not accessible to screen readers. Please switch to the table view to access the data.
Loading statistic...
Download
Source
Source
In cooperation with
Rakuten Insight
Release date
June 2020
More information
Region
Vietnam
Survey time period
May 7 to 30, 2020
Number of respondents
1,256 respondents
Age group
16 years and older
Special properties
among female and male respondents
Method of interview
Online survey
Supplementary notes
Original question: Which food items did you purchase most frequently online/ on e-commerce sites during the COVID-19 pandemic? (more than one answer is allowed)
Other surveyed countries included China, Hong Kong, India, Indonesia, Korea, Malaysia, Philippines, Singapore and Taiwan.
Citation formats



