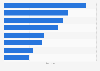


| Characteristic | Share of respondents |
|---|---|
| Clothing, apparel, and fashion accessories | 47.48% |
| Food and groceries (incl. non alcoholic beverages) | 42.23% |
| Personal hygiene products (incl. toilet paper, hand sanitizer, and masks) | 40.18% |
| Cosmetics and beauty products | 33.73% |
| Household cleaning products | 32.78% |
| Books and stationery | 31.67% |
| Consumer technology and electronics | 24.18% |
| Toys, games and puzzles | 17.28% |
| Furniture and household items | 17.18% |
| Sports equipment and apparel | 16.68% |
| Medication | 13.95% |
| Pet food and related supplies | 13.01% |
| Movies, music and television entertainment | 12% |
| Hobby and arts and craft supplies | 7.77% |
| Alcoholic beverages | 7.53% |
| Others | 5.58% |
The chart is not accessible to screen readers. Please switch to the table view to access the data.
Loading statistic...
Download
Source
Source
In cooperation with
Rakuten Insight
Release date
June 2020
More information
Region
Vietnam
Survey time period
May 7 to 30, 2020
Number of respondents
2,974 respondents
Age group
16 years and older
Special properties
among female and male respondents
Method of interview
Online survey
Supplementary notes
Original question: What products did you purchase more frequently online/ on e-commerce sites during the COVID-19 pandemic, compared to before the pandemic?
(more than one answer is allowed)
Other surveyed countries included China, Hong Kong, India, Indonesia, Korea, Malaysia, Philippines, Singapore and Taiwan.
Citation formats



