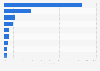
| Characteristic | Share of home sellers |
|---|---|
| - | - |
| - | - |
| - | - |
| - | - |
| - | - |
The chart is not accessible to screen readers. Please switch to the table view to access the data.
Download
Source
Source
Release date
October 2019
More information
Region
United States
Survey time period
April 17 to May 22, 2019
Number of respondents
3,000 respondents
Special properties
primary (or joint) decision-maker in household, sold home in past 12 months and moved primary residence in past 12 months
Method of interview
Online survey
Citation formats