| Characteristic | 2018 | 2019 | 2020 | 2021 |
|---|---|---|---|---|
| - | - | - | - | - |
| - | - | - | - | - |
| - | - | - | - | - |
| - | - | - | - | - |
| - | - | - | - | - |
| - | - | - | - | - |
| - | - | - | - | - |
| - | - | - | - | - |
| - | - | - | - | - |
| - | - | - | - | - |
| - | - | - | - | - |
| - | - | - | - | - |
| - | - | - | - | - |
| - | - | - | - | - |
| - | - | - | - | - |
| - | - | - | - | - |
| - | - | - | - | - |
| - | - | - | - | - |
| - | - | - | - | - |
| - | - | - | - | - |
| - | - | - | - | - |
| - | - | - | - | - |
| - | - | - | - | - |
| - | - | - | - | - |
| - | - | - | - | - |
| - | - | - | - | - |
| - | - | - | - | - |
| - | - | - | - | - |
| - | - | - | - | - |
| - | - | - | - | - |
| - | - | - | - | - |
| - | - | - | - | - |
| - | - | - | - | - |
| - | - | - | - | - |
| - | - | - | - | - |
| - | - | - | - | - |
| - | - | - | - | - |
| - | - | - | - | - |
| - | - | - | - | - |
| - | - | - | - | - |
| - | - | - | - | - |
| - | - | - | - | - |
| - | - | - | - | - |
| - | - | - | - | - |
| - | - | - | - | - |
| - | - | - | - | - |
| - | - | - | - | - |
| - | - | - | - | - |
| - | - | - | - | - |
| - | - | - | - | - |
| - | - | - | - | - |
| - | - | - | - | - |
| - | - | - | - | - |
| - | - | - | - | - |
| - | - | - | - | - |
The chart is not accessible to screen readers. Please switch to the table view to access the data.
November 2021
Germany
2018 to 2021
14 years and older
German-speaking population
Face-to-face interview
Information on main unit:
Base: German-speaking population aged 14 and older.
Information on total sample:
2018: 23,086 respondents, projection to 70.45 million people
2019: 23,120 respondents, projection to 70.60 million people
2020: 23,138 respondents, projection to 70.63 million people
2021: 23,299 respondents, projection to 70.54 million people
The figures displayed refer to the following studies:
2018: VuMA 2019; 2019: VuMA 2020; 2020: VuMA 2021; 2021: VuMA 2022
Further information on methodology available and in the .
Figures were rounded for better understanding of the statistic.
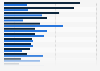
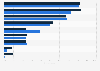
This statistic is the result of calculations based on various characteristics in the survey. The question was not asked directly. During the survey participants had to answer how often they pursued the listed leisure activities. This statistic shows the 10 leisure activities with the highest share of participants who answered 鈥淪everal times a week鈥� or 鈥淪everal times a month鈥�.