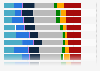
| Characteristic | Share of respondents |
|---|---|
| 2019 | 36% |
| 2018 | 34% |
| 2017 | 36% |
| 2016 | 41% |
| 2015 | 22% |
| 2014 | 24% |
| 2013 | 26% |
| 2012 | 30% |
| 2008 | 20% |
| 2006 | 15% |
| 2005 | 16% |
| 2004 | 18% |
| 2003 | 15% |
| 2002 | 15% |
| 2001 | 14% |
| 2000 | 17% |
| 1999 | 13% |
| 1998 | 14% |
| 1997 | 17% |
| 1996 | 19% |
| 1995 | 14% |
| 1994 | 11% |
| 1993 | 11% |
| 1992 | 10% |
The chart is not accessible to screen readers. Please switch to the table view to access the data.
Loading statistic...
Download
Source
Source
Release date
August 2019
More information
Region
United Kingdom (Great Britain)
Survey time period
1992-2019
Number of respondents
3,224*
Age group
18 years and older
Special properties
Residents of Great Britain
Method of interview
Face-to-face interview
Supplementary notes
Survey count varies by year;
1992: 2,855, 1993: 1,461,1994: 1,165, 1995: 1,165, 1996: 1,180
1997: 1,355, 1998: 1,035, 1999: 1,060, 2000: 2,293, 2001: 1,099
2002: 3,435, 2003: 2,293, 2004: 3,199, 2005: 4,238, 2006: 1,077
2008: 1,128, 2012: 1,103, 2013: 2,147, 2014: 971, 2015: 1,105
2016: 1,965, 2017: 2,009, 2018: 2,926
Citation formats