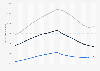
| Region of embarkation | Brazil | Mainland North America | Caribbean | Spanish Mainland Americas | Average |
|---|---|---|---|---|---|
| African total | 44.9 | 66.5 | 68.7 | 77.5 | 60.1 |
| Southeast Africa and Indian Ocean islands | 66.7 | 88.3 | 108.3 | 85.1 | 76.6 |
| Gold Coast | 58.8 | 83.9 | 76.3 | 77 | 74.8 |
| Bight of Biafra and Gulf of Guinea islands | 49.3 | 87.4 | 71.5 | 143.6 | 69 |
| Bight of Benin | 50.2 | 110 | 96.7 | 95.4 | 66.8 |
| Windward Coast** | - | 56.1 | 65.7 | 96 | 61.9 |
| Other Africa | 51.3 | 66.1 | 65 | 75.5 | 61.4 |
| Senegambia and offshore Atlantic | 46.3 | 52.3 | 44.2 | 72.2 | 52.6 |
| West Central Africa and St. Helena | 38.4 | 65 | 63 | 73.6 | 49.4 |
| Sierra Leone | 33 | 54.7 | 47.9 | 56.5 | 46.5 |
The chart is not accessible to screen readers. Please switch to the table view to access the data.
Loading statistic...
Download
Source
Source
Release date
January 2021
More information
Region
Africa, North America, Latin America and the Caribbean
Survey time period
1501 to 1866
Supplementary notes
*Also includes voyages to Europe and other parts of Africa.
**No data given for voyages to Brazil.
These figures are based on existing shipping records only, and are not estimates for the averages during the entirety of the transatlantic slave trade.
Release date is date of most recent data access.
Citation formats