| Region | Free | Slave |
|---|---|---|
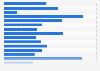
| East: Rio de Janiero** | 42.48% | 57.52% |
| South: Santa Catarina | 51.61% | 48.39% |
| East: Espirito Santo | 54.71% | 45.29% |
| South: Rio Grande do Sul | 55.02% | 44.98% |
| South: S茫o Paolo | 57.03% | 42.97% |
| East: Minas Gerais | 68.51% | 31.49% |
| Northeast: Maranh茫o | 69.36% | 30.64% |
| BRAZIL TOTAL | 73.75% | 26.25% |
| South: Paran谩 | 77.97% | 22.03% |
| North: Par谩 | 80.09% | 19.91% |
| Center-West: Mato Grosso | 80.76% | 19.24% |
| East: Sergipe | 81.66% | 18.34% |
| East: Bahia | 83.19% | 16.81% |
| Northeast: Pernambuco | 83.47% | 16.53% |
| Northeast: Piau铆 | 83.63% | 16.37% |
| Northeast: Alagoas | 85.86% | 14.14% |
| Northeast: Rio Grande do Norte | 89.19% | 10.81% |
| North: Amazonas | 89.77% | 10.23% |
| Northeast: Para铆ba | 90.3% | 9.7% |
| Center-West: Goi谩s | 90.67% | 9.33% |
| Northeast: Cear谩 | 92.02% | 7.98% |
The chart is not accessible to screen readers. Please switch to the table view to access the data.
Loading statistic...
Download
Source
Source
Release date
December 2020
More information
Region
Brazil
Survey time period
1872
Supplementary notes
The term "colored" was used by the source, but has been changed to "non-white" to reflect modern attitudes. This data does not appear to include indigenous people, or those of mixed white and indigenous descent ("caboclo").
Figures have been calculated using the total populations given in the source, as a number of the percentages given by the source included errors.
Release date is most recent date of data access
Citation formats