



T. Ozbun
Research expert covering food retail and all food topics for Italy and Brazil
Get in touch with us nowThe chart is not accessible to screen readers. Please switch to the table view to access the data.
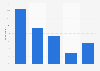
In a 2024 survey, ** percent of responding consumers from the generation of the baby boomers stated that they plan their dishes in advance. Another聽** percent of Gen Z consumers stated that quick preparation of food is important to them. The survey was carried out in the U.S. in September 2024.
Log in or register to access precise data.
About the industry
About the region
Selected statistics
Other regions
Related statistics