
Matej Mikulic
Research expert covering health, pharma & medtech
The U.S. home care sector is fundamentally shaped by demographic change, with a steadily aging population increasing demand for long-term and in-home care services. By 2026, nearly one in five Americans is aged 65 or older, with this share projected to rise further in the coming decades. At the same time, functional limitations among older adults are becoming more widespread, as only about one in five seniors remains fully able to perform basic self-care and mobility tasks. This growing need for assistance is reinforced by the rising prevalence of age-related conditions such as Alzheimer鈥檚 disease, which is expected to affect almost 14 million older Americans by 2060. Despite these challenges, a strong preference for aging in place persists, with a clear majority of older adults expressing the desire to remain at home even in the event of serious illness.
While demand fundamentals are strengthening, utilization trends present a more nuanced picture. The number of Medicare-funded home health users has declined slightly in recent years, falling to around 2.7 million in 2024, suggesting potential access constraints or shifts in care delivery models. At the same time, the profile of home care users highlights significant care intensity: the vast majority require assistance with multiple activities of daily living such as bathing, dressing, and mobility. In addition, around one-third of home health patients live with dementia, underscoring the complexity of care provided in home settings. These trends indicate that home care is increasingly serving patients with higher acuity needs, even as overall utilization growth remains uneven.
The structure of the home care market remains highly fragmented, with the number of agencies declining from earlier peaks to just over 11,500 in recent years. At the same time, the sector has become increasingly dominated by for-profit providers, which now account for more than four in five agencies. Workforce constraints represent a key bottleneck: although employment in home health services has grown to around 1.5 million workers, wage levels remain relatively modest at under 17 U.S. dollars per hour on average. Combined with high turnover rates and rising demand, these factors continue to strain system capacity. As a result, the industry faces mounting pressure to balance affordability, workforce sustainability, and quality of care in an expanding but resource-constrained market.
The U.S. home care sector is structurally positioned for sustained expansion, driven by demographic aging and strong consumer preference for aging in place. However, future growth will depend less on demand and more on the sector鈥檚 ability to scale supply, with workforce constraints remaining the primary bottleneck. Despite rising employment, persistent shortages鈥攄riven by relatively low wages and high turnover鈥攃ontinue to limit capacity. This imbalance is expected to persist, particularly for higher-acuity patients, and may increasingly constrain access to care.
At the same time, the market is undergoing gradual consolidation and operational change. The dominance of for-profit providers and ongoing M&A activity point toward greater scale and standardization. Policy developments, particularly in Medicare reimbursement and value-based care, are likely to further reshape care delivery. Technology will play a supporting role in improving efficiency, especially through remote monitoring and digital coordination. However, without meaningful improvements in workforce conditions, the gap between growing demand and available care capacity is expected to widen.

Detailed statistics
Home health care expenditure in the U.S. 1960-2024

Detailed statistics
Number of Medicare home health users in the U.S. 2019-2024

Detailed statistics
Largest home health agencies in the U.S. as of 2024, by patient number

Seniors as a percentage of the total population in the U.S. 1950-2050
Share of the United States population aged 65 years and older from 1950 to 2050

Share of older U.S. adults with self-care and mobility limitations 2011-2021
Percentage of older adults who reported being fully able or having difficulty carrying out self-care and mobility activities in the U.S. from 2011 to 2021

Projected numbers of older people with Alzheimer's in the U.S. 2020-2060
Projected numbers of older people with Alzheimer鈥檚 in the U.S. from 2020 to 2060* (in millions)

U.S. adults wanting to remain at home if they were diagnosed with dementia in 2024
Percentage of older U.S. adults who said it was important to remain in their home if they were diagnosed with dementia as of 2024

Share of U.S. adults who believed it was important to age in place 2024, by age
Percentage of U.S. adults who said it was important to remain in their homes for as long as possible in 2024, by age group
Number of Medicare home health users in the U.S. 2019-2024
Number of Medicare fee-for-service home health care users in the U.S. from 2019 to 2024 (in millions)

Gender of long-term care users in the U.S. 2022, by setting
Percentage of users of U.S. long-term care services in 2022, by setting and gender

Age of long-term care services users in the U.S. 2022, by setting
Percentage of U.S. users of long-term care services in 2022, by setting and age group

Ethnicity of long-term care users in the U.S. 2022, by setting
Percentage of U.S. users of long-term care services in 2022, by setting and race and ethnicity

Long-term care service users in the U.S. with dementia or depression 2022, by setting
Percentage of U.S. users of long-term care services with dementia, depression, or diabetes in 2022, by setting

Share of U.S. home health clients needing help with ADLs 2020-2022
Percentage of home health services users requiring assistance with activities of daily living (ADLs) in the U.S. in 2020 and 2022
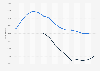
Number of home health agencies in the U.S. 2010-2024
Number of active home health agencies in the U.S. from 2010 to 2024

Number of long-term care service providers in the U.S. 2012-2022, by setting
Number of U.S. post-acute and long-term care service providers from 2012 to 2022, by setting

Ownership of home health care providers in the U.S. 2014-2022
Distribution of home health care service providers in the U.S. from 2014 to 2022, by ownership

Share of U.S. home health agencies that were Medicare- and Medicaid-certified 2022
Percentage of home health agencies in the U.S. that were Medicare- and Medicaid-certified in 2020 and 2022

Size of home health agencies in the U.S. 2022
Distribution of home health care services providers in the U.S. in 2022, by number of people served annually
Largest home health agencies in the U.S. as of 2024, by patient number
10 largest home health agencies in the U.S. as of 2024, by total number of patients

Ranking of home health agencies in the U.S. as of 2024, by net patient revenue
Ranking of home health agencies in the U.S. as of 2024, by net patient revenue (in million U.S. dollars)

U.S. direct care workers average median hourly wages 2010-2024, by industry
Median average hourly wages for direct care workers in the U.S. from 2010 to 2024 (in U.S. dollars), by industry

Number of home health care employees in the U.S. 2000-2025
Number of persons employed in home health care services in the U.S. from 2000 to 2025 (in 1,000)

Number of home health aides in the U.S. 2001-2025
Number of home health aides in the U.S. from 2001 to 2025

Home health care workers per elderly in the U.S. 2016-2023
Number of home health care workers in the U.S. from 2016 to 2023 (per 1,000 adults aged 65 years or older)

Gender distribution of U.S. home care workers 2023
Distribution of home care workers in the U.S. in 2023, by gender

Age distribution of U.S. home care workers 2023
Distribution of home care workers in the U.S. in 2023, by age group

Share of U.S. home care workers 2023, by ethnicity
Distribution of home care workers in the U.S. in 2023, by race and ethnicity

Home care staff turnover rate in the U.S. 2017-2024
Home care turnover rate in the United States, from 2017 to 2024

Revenue in the home health care service sector 2006-2023
Estimated revenue in the U.S. home health care service sector from 2006 to 2023 (in million U.S. dollars)

Gross output of home health care services 1998-2024
Gross output of home health care services in the U.S. from 1998 to 2024 (in billion U.S. dollars)
Home health care expenditure in the U.S. 1960-2024
Home health care expenditure in the United States from 1960 to 2024 (in billion U.S. dollars)

Home health spending in the United States by payer 2013-2023
Spending for home health in the United States from 2013 to 2023, by payer (in billion U.S. dollars)

Annual costs of long-term care services in the U.S. in 2025, by type
Annual median cost of long-term health care services in the United States as of 2025, by type (in U.S. dollars)

Hourly rate of home care in the U.S. 2019-2060, by
Median hourly costs of homemaker services and home health aides in the U.S. from 2019 to 2024, with a forecast till 2060 (in U.S. dollars)

Most expensive U.S. states for non-medical home care services 2025
Leading 10 U.S. states with the highest annual cost for in-home care non-medical caregivers in 2025 (in U.S. dollars)

Number of high-quality U.S. home health agencies 2018-2023, by type of star rating
Number of Medicare-certified home health agencies in the U.S. with a star rating of four or higher from 2018 to 2023, by type of home health star ratings
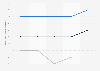
Patient rating of home care workers on care quality measures 2019-2025
Percentage of patients who said their home health team did well on three patient quality measures from 2019 to 2025

Patient rating and recommendation of home health agency U.S. 2019-2025
Percentage of patients who gave their home health agency a high score and would recommend it to friends and family from 2019 to 2025

Patient improvements while in home health care U.S. 2019-2025
Percentage of home health episodes in which patients performed better on select patient outcomes in the U.S. from 2019 to 2025
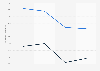
Patient hospitalization or ER visit while in home health care U.S. 2019-2023
Percentage of home health episodes in which patients had to be hospitalized or needed the emergency room in the U.S. from 2019 to 2023
Feel free to contact us anytime. We will respond to your inquiry as quickly as possible.


