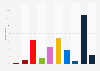
| Characteristic | Volodymyr Zelenskyy | Petro Poroshenko | Would spoil the ballot | Hard to say / did not know | Refused to answer | Would not vote |
|---|---|---|---|---|---|---|
| All regions | 48.4% | 17% | 1.6% | 17.9% | 8.8% | 6.3% |
| Center | 49% | 17.4% | 1.9% | 18.5% | 9.2% | 4% |
| Donbas | 56.1% | 3% | 2.3% | 22.7% | 8.3% | 7.6% |
| East | 58.8% | 8.1% | 0.5% | 14% | 11.3% | 7.4% |
| South | 54.2% | 9.2% | 2.9% | 17.9% | 5% | 10.8% |
| West | 34.8% | 30.5% | 1.3% | 18.9% | 8.3% | 6.1% |
The chart is not accessible to screen readers. Please switch to the table view to access the data.
April 2019
Ukraine
April 9-14, 2019
2,004 respondents
18 years and older
Respondents from 129 settlements of all regions in Ukraine (except Crimea)
Face-to-face interview
* The original question asked by the source was "Imagine that the second round of the presidential election is taking place now, and the election commission came to you and provided you with a voting ballot. Would you vote or not? Which of the candidates would you vote for?"
In Luhansk and Donetsk regions, the poll was conducted only on the territory controlled by the Ukrainian authorities.
The statistical sampling error with a probability of 0.95 and a design effect of 1.5 does not exceed 3.3 percent for indicators close to 50 percent, 2.8 percent for indicators close to 25 percent, two percent for indicators close to 10 percent, and 1.4 percent for indicators close to five percent.