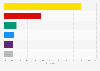
| Characteristic | 18-24 years old | 25-34 years old | 35-49 years old | 50-59 years old | 60-69 years old | 70 years old and over |
|---|---|---|---|---|---|---|
| - | - | - | - | - | - | - |
| - | - | - | - | - | - | - |
| - | - | - | - | - | - | - |
| - | - | - | - | - | - | - |
| - | - | - | - | - | - | - |
| - | - | - | - | - | - | - |
| - | - | - | - | - | - | - |
| - | - | - | - | - | - | - |
| - | - | - | - | - | - | - |
| - | - | - | - | - | - | - |
The chart is not accessible to screen readers. Please switch to the table view to access the data.
Download
Source
Sources
Release date
June 2022
More information
Region
France
Survey time period
June 8 to 11, 2022
Number of respondents
3,995 respondents
Age group
18 years and older
Special properties
Abstainers, i.e. 52.3 percent of the sample
Method of interview
Online Access Panel
Supplementary notes
The question was phrased by the source as follows: "Parmi les raisons suivantes, quelles sont les trois qui expliquent le mieux pourquoi vous envisagez de ne pas voter lors du premier tour des 茅lections l茅gislatives ?"
Three possible answers.
Citation formats