| Characteristic | Value drivers | Risk drivers |
|---|---|---|
| - | - | - |
| - | - | - |
| - | - | - |
| - | - | - |
| - | - | - |
| - | - | - |
| - | - | - |
| - | - | - |
| - | - | - |
| - | - | - |
| - | - | - |
| - | - | - |
| - | - | - |
| - | - | - |
| - | - | - |
The chart is not accessible to screen readers. Please switch to the table view to access the data.
October 2020
Worldwide, Netherlands
January 1, 2020 to December 31, 2020
53,931 respondents
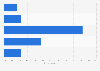
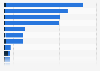
* The brands are monitored on the basis of approximately 200 distinct characteristics, which are allocated to 15 positive perceptional dimensions (value drivers) and 15 negative perceptional dimensions (risk drivers). The scale states each dimension's frequency relative to all statements about the brand in the defined time period. Together, these 15 dimensions make up the media perception
TheBrandTicker of Adwired measures how companies and brands are actually talked about, based on information gathered from print, online, and social media. Contributions (clippings) from approx. 15鈥�000 international print, 750鈥�000 online, and 250 million social media, as well as financial market information (market capitalization of companies) form the basis of the analysis. Social media consist primarily of blogs, Facebook, and forum contributions. Low text content like Twitter is excluded.
Missing percentage points to 100 percent are probably due to rounding.