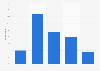
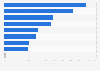
| Characteristic | 2017 | 2018 | 2019 |
|---|---|---|---|
| - | - | - | - |
| - | - | - | - |
| - | - | - | - |
| - | - | - | - |
The chart is not accessible to screen readers. Please switch to the table view to access the data.
Download
Source
Source
Release date
November 2019
More information
Region
Netherlands
Survey time period
2017 to 2019
Number of respondents
879 (2017), 840 (2018) and 937 (2019)
Age group
18-65 years
Special properties
Dutch consumers
Method of interview
Online panel
Supplementary notes
This question was phrased by the source as follows: "How much are you planning to spend per celebration during
the holidays?"
The figures have been taken from several publications.
Citation formats