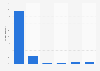
| Characteristic | Movies, TV series & other TV programs when broadcasted | Live news, sports & other events (both broadcasted and live streamed) | UGC & e-sport live | Movies, TV series & other TV programs on-demand | UGC & e-sport on-demand | Movies, TV series & other TV programs downloaded | Movies, TV series & other TV programs recorded |
|---|---|---|---|---|---|---|---|
| - | - | - | - | - | - | - | - |
| - | - | - | - | - | - | - | - |
| - | - | - | - | - | - | - | - |
| - | - | - | - | - | - | - | - |
| - | - | - | - | - | - | - | - |
| - | - | - | - | - | - | - | - |
The chart is not accessible to screen readers. Please switch to the table view to access the data.
Download
Source
Source
Release date
October 2017
More information
Region
Worldwide
Survey time period
2017
Number of respondents
20,000*
Age group
16-69 years
Special properties
among those who have a broadband internet connection at home and watch TV or video at least once a week
Method of interview
Online interview
Supplementary notes
* respondents came from 13 countries: Brazil, Canada, China, Germany, India, Italy, Russia, South Korea, Spain, Sweden, Taiwan, the U.K., and the U.S.
The source does not provide a date of survey. The date provided is the publication date.
Citation formats