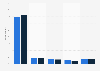
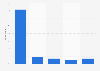
| Characteristic | 16 to 29 years | 30 to 39 years | 40 to 49 years | 50 to 59 years | 60 to 69 years | 70 years and above |
|---|---|---|---|---|---|---|
| - | - | - | - | - | - | - |
| - | - | - | - | - | - | - |
| - | - | - | - | - | - | - |
| - | - | - | - | - | - | - |
| - | - | - | - | - | - | - |
| - | - | - | - | - | - | - |
The chart is not accessible to screen readers. Please switch to the table view to access the data.
Download
Source
Source
Release date
September 2021
More information
Region
Japan
Survey time period
October 28 to December 7, 2020
Number of respondents
927 respondents
Age group
16 years and older
Method of interview
Postal questionnaire
Supplementary notes
In the case of answers for which the share of respondents amounted to zero percent, figures have been omitted.
Sample size of age groups:
16 to 29 years: n=111
30 to 39 years: n=78
40 to 49 years: n=138
50 to 59 years: n=147
60 to 69 years: n=178
70 years and above: n=275
Citation formats