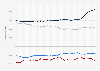
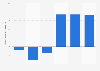
| Characteristic | Belgium | Luxembourg | Netherlands |
|---|---|---|---|
| Q2 of 2020 | 1,916.5鈧� | - | 1,848.8鈧� |
| Q1 of 2020 | 1,019.2鈧� | - | 1,219.2鈧� |
| Q4 of 2019 | 602.4鈧� | - | 1,092.5鈧� |
| Q3 of 2019 | 535.9鈧� | - | 1,076.1鈧� |
| Q2 of 2019 | 461.4鈧� | - | 1,069.2鈧� |
| 2019 | 602.4鈧� | - | 1,092.5鈧� |
| 2018 | 108.3鈧� | 3,805.3鈧� | 932.7鈧� |
| 2017 | 74.8鈧� | 3,354.2鈧� | 960.9鈧� |
| 2016 | 33.6鈧� | 2,548.1鈧� | 1,288.3鈧� |
| 2015 | 151.5鈧� | 2,837.4鈧� | 1,477.4鈧� |
| 2014 | 341鈧� | 2,788.7鈧� | 1,732.6鈧� |
| 2013 | 478.8鈧� | 2,975.3鈧� | 1,647.9鈧� |
The chart is not accessible to screen readers. Please switch to the table view to access the data.
Loading statistic...
Download
Source
Source
Release date
September 2020
More information
Region
Belgium, Luxembourg, Netherlands
Survey time period
2013 to 2020 Q2
Supplementary notes
The source indicates that "unless otherwise indicated, all data presented in this report are compiled according to the European System of Accounts (ESA) 2010". Also, the numbers used include net capital transfers. The number provided by the source, is the sum of the fourth quarter in the corresponding year.
Citation formats