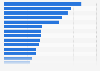
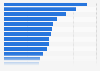
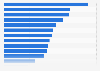
| Characteristic | Net foreign currency lending to private sector | Net lending to public sector (including coin) | Net lending to non-residents | Net other assets |
|---|---|---|---|---|
| Jul '20 | -158,220 | 853,276 | 436,407 | -331,217 |
| Jun '20 | -166,644 | 821,397 | 425,947 | -275,190 |
| May '20 | -166,294 | 794,401 | 447,899 | -283,813 |
| Apr '20 | -174,990 | 724,322 | 435,304 | -285,683 |
| Mar '20 | -176,268 | 636,309 | 427,919 | -261,508 |
| Feb '20 | -147,208 | 618,141 | 395,083 | -267,601 |
| Jan '20 | -150,043 | 616,008 | 394,134 | -304,702 |
| Dec '19 | -168,252 | 598,410 | 399,085 | -316,228 |
| Nov '19 | -168,220 | 615,281 | 406,422 | -306,057 |
| Oct '19 | -163,197 | 619,772 | 394,025 | -315,865 |
| Sep '19 | -172,933 | 612,551 | 404,206 | -263,915 |
| Aug '19 | -197,800 | 597,808 | 443,967 | -258,715 |
| Jul '19 | -208,547 | 595,871 | 474,887 | -274,498 |
| Jun '19 | -217,787 | 591,969 | 465,145 | -313,073 |
| May '19 | -216,580 | 591,927 | 473,938 | -305,465 |
| Apr '19 | -205,758 | 581,059 | 461,426 | -295,013 |
| Mar '19 | -211,774 | 586,558 | 450,542 | -287,268 |
| Feb '19 | -204,992 | 583,621 | 452,219 | -323,825 |
| Jan '19 | -215,557 | 583,752 | 452,210 | -311,637 |
| Dec '18 | -237,557 | 575,144 | 506,735 | -315,457 |
| Nov '18 | -255,549 | 573,922 | 508,427 | -308,003 |
| Oct '18 | -257,820 | 575,436 | 543,829 | -314,194 |
| Sep '18 | -226,376 | 579,753 | 523,675 | -363,836 |
| Aug '18 | -217,670 | 594,635 | 545,859 | -376,461 |
The chart is not accessible to screen readers. Please switch to the table view to access the data.
Loading statistic...
Download
Source
Source
Release date
September 2020
More information
Region
United Kingdom
Survey time period
August 2018 to July 2020
Supplementary notes
Movements in amounts outstanding can reflect breaks in data series as well as underlying flows. For changes data, users are recommended to refer directly to the appropriate series or data tables. Further explanation can be found here
Citation formats