
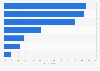


| Characteristic | 2016 | 2017 |
|---|---|---|
| - | - | - |
| - | - | - |
| - | - | - |
| - | - | - |
| - | - | - |
| - | - | - |
| - | - | - |
| - | - | - |
| - | - | - |
| - | - | - |
| - | - | - |
| - | - | - |
| - | - | - |
| - | - | - |
| - | - | - |
| - | - | - |
| - | - | - |
| - | - | - |
| - | - | - |
| - | - | - |
The chart is not accessible to screen readers. Please switch to the table view to access the data.
Download
Source
Sources
Release date
October 2017
More information
Region
Mexico
Survey time period
May to July 2016 and 2017
Number of respondents
2016: n=1,829; 2017: n=1,019
Age group
18 years and older
Special properties
Realized purchase via computer, smartphone or tablet within the previous three months.
Method of interview
Email survey
Supplementary notes
Original questions: "Por favor, eche un vistazo a la siguiente tabla. En cada categor铆a, ingrese la cantidad de dinero en pesos que gast贸 en l铆nea, de mayo de 2017 a julio de 2017, de cada tipo de dispositivo que ha utilizado para transacciones en l铆nea."
Note: Category "Transport" was added to the 2017 survey.
Date of survey for 2016 is provided in previous edition.
Citation formats



