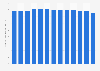
| Characteristic | Index score |
|---|---|
| Singapore | 84 |
| New Zealand | 83 |
| Australia | 77 |
| Hong Kong | 74 |
| Bhutan | 72 |
| Japan | 71 |
| Taiwan | 67 |
| South Korea | 64 |
| Malaysia | 50 |
| Timor-Leste | 44 |
| China | 43 |
| Vietnam | 40 |
| India | 38 |
| Maldives | 38 |
| Indonesia | 37 |
| Nepal | 34 |
| Thailand | 34 |
| Laos | 33 |
| Mongolia | 33 |
| Philippines | 33 |
| Sri Lanka | 32 |
| Papua New Guinea | 31 |
| Pakistan | 27 |
| Bangladesh | 23 |
| Cambodia | 21 |
| Myanmar | 16 |
| North Korea | 15 |
The chart is not accessible to screen readers. Please switch to the table view to access the data.
Loading statistic...
Download
Source
Source
Release date
February 2025
More information
Region
Asia, APAC
Survey time period
2024
Supplementary notes
To compile the corruption perception index data is pooled from various surveys and studies and a score between 0 and 100 is calculated. A score of 0 indicates high perceptions of corruption and a score of 100 indicates that no corruption is perceived in the respective country. The original author does not provide details of exactly where data is sourced from to calculate this index.
Citation formats