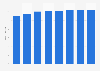
| Characteristic | Distribution of weekly time spent |
|---|---|
| - | - |
| - | - |
| - | - |
| - | - |
| - | - |
The chart is not accessible to screen readers. Please switch to the table view to access the data.
Download
Source
Source
Release date
January 2017
More information
Region
United States
Survey time period
August 29, 2016 to September 25, 2016
Age group
18-49 years
Supplementary notes
Share may sum up to over 100% due to rounding.
Citation formats